, ETMarkets.com|
Updated: Sep 20, 2017, 10.42 AM IST

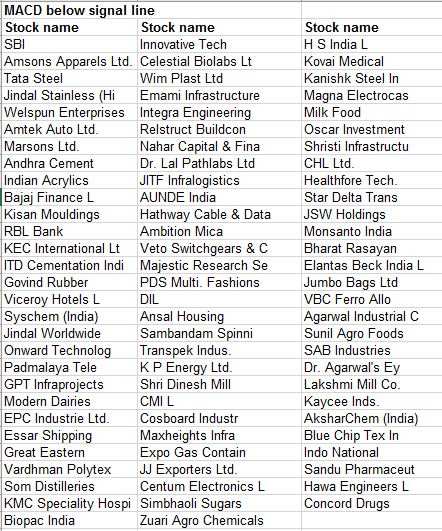
When equity benchmark BSE Sensex snapped an eight-day winning streak on Tuesday to close in the red, as many as 85 stocks on BSE witnessed bearish crossovers, indicating downward pressure on these counters.
Going by momentum indicator Moving Average Convergence Divergence, or MACD, these stocks look poised to come crushing down anytime now.
Among the stocks that witnessed bearish crossovers on Tuesday were several prominent names such as SBI, Tata Steel, Jindal Stainless (Hisar), Welspun Enterprises, Amtek Auto, Andhra Cement, RBL Bank, KEC International, Govind RubberBSE , ITD Cementation and Bajaj Finance.
The outlook for the broader market has turned sluggish since the Nifty50 scaled a new lifetime peak on Monday as macro-economic fundamentals of the domestic economy sent out signs of distress. On Tuesday, the BSE Sensex slipped 21.39 points, or 0.07 per cent, to close at 32,402, while NSE’s Nifty50 index settled 5.55 points, or 0.05 per cent, lower at 10,147.
“The Nifty has to continue to hold above 10,138 to extend its move towards 10,200 and then 10,270 levels, while on the downside, supports are seen at 10,080 and 10,050 levels,” said Chandan Taparia, Derivatives and Technical Analyst, Motilal Oswal Financial Services.
Stewart & Mackertich said considering Nifty’s multiple timeframe and overall chart patterns, the Nifty50 should remain stuck in the 10,120-10,180 band ahead of the FOMC decision on Fed funds rate scheduled to be released later on Wednesday. Many of the counters that witnessed bearish crossovers also saw strong trading volume, which adds further credence to the emerging trend. Other names on the list include Emami Infrastructure Dr Lal Pathlabs, Som Distilleries, Oscar Investment and JSW Holdings.
The MACD is one of the most effective trends-following momentum indicators used to spot a change in the short-term trend of the market.
The MACD is a trend-following momentum indicators used to spot a change in the short-term trend of the market.
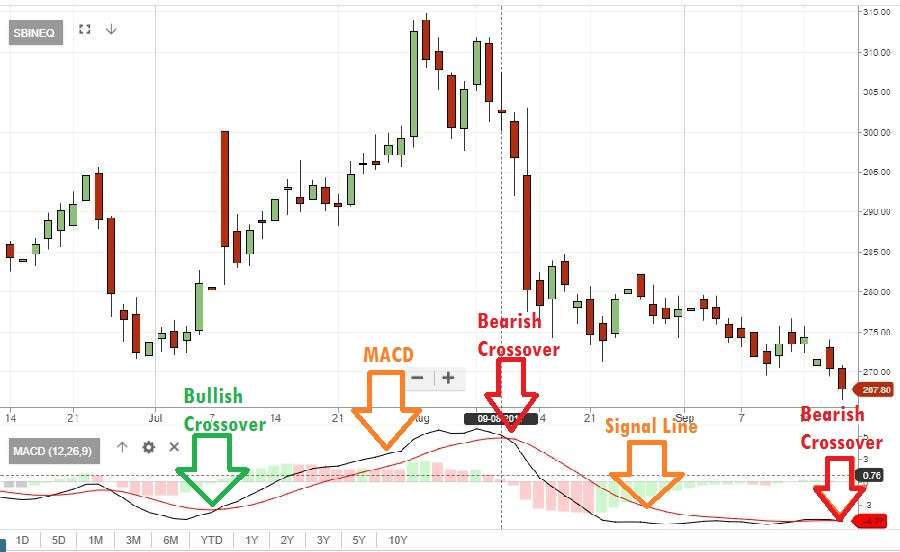
The MACD is a trend-following momentum indicator that shows the relationship between two moving averages of prices. It is the difference between the 26-day and 12-day exponential moving averages. A nine-day exponential moving average, called the ‘signal’ line, is plotted on top of the MACD to show ‘buy’ or ‘sell’ opportunities. A ‘sell’ signal occurs when the MACD falls below the signal line and vice-versa.

However, the MACD indicator alone may not be sufficient to take an investment or trading call. Traders should make use of other indicators such as Fibonacci series, RSI, candlestick patterns, Bollinger Bands and Stochastic to confirm any emerging trend.
Investors should consult financial experts before buying or selling a stock based on such technical signals.
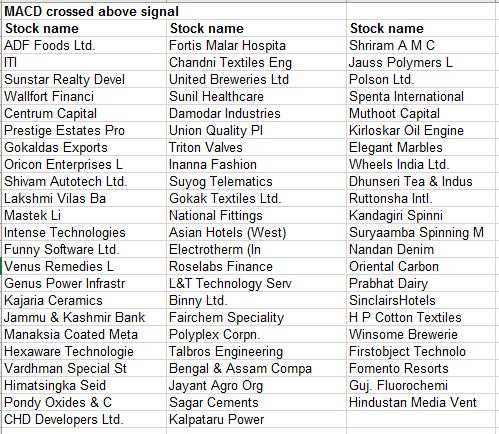
MACD charts also threw up bullish signals for 68 stocks on BSE, as they witnessed upward crossovers or bullish crossover on Tuesday, indicating the commencement of an upward journey.

In a bearish crossover, the MACD value will always be lower than that of the signal value. For example, in Hindustan Zinc, the MACD value is 6.53 and the signal line value is 6.62. Tata Steel’s MACD value is 20.35, which is below its signal line value of 20.69.
Understanding MACD

A close look at the technical chart of State Bank of IndiaBSE 1.40 % shows whenever the MACD line has crossed below the signal line, the stock has always shown a downward momentum and vice-versa.
The similar downward crossover was recorded on Tuesday when the Nifty closed in the red. SBI shares closed 0.87 per cent down at Rs 267.80 in the previous session.
No comments:
Post a Comment